


Studying urban inequality in Alaska and the U.S.
by Ted Kincaid |
 UAA professor and urban sociologist Chad Farrell, Ph.D., in collaboration with his
colleagues at Penn State, has been tracking one of the most profound demographic changes
in America in the last half-century: the increasing racial and ethnic diversity across
the U.S. This trend, from big cities to small towns, is changing your state, your
town, your neighborhood. And the results of exhaustive study of the 2010 U.S. Census
data by sociologists like Farrell, who are interested in urban inequality, is informing
policies and politicians, from the ballot headliners you've seen splashed across television
and other media to the names you struggle to recognize at the polls without your voting
guide.
UAA professor and urban sociologist Chad Farrell, Ph.D., in collaboration with his
colleagues at Penn State, has been tracking one of the most profound demographic changes
in America in the last half-century: the increasing racial and ethnic diversity across
the U.S. This trend, from big cities to small towns, is changing your state, your
town, your neighborhood. And the results of exhaustive study of the 2010 U.S. Census
data by sociologists like Farrell, who are interested in urban inequality, is informing
policies and politicians, from the ballot headliners you've seen splashed across television
and other media to the names you struggle to recognize at the polls without your voting
guide.
Farrell's current research of integration and diversity actually stemmed from earlier study of residential segregation. "I've been focused so much on the separation of groups, now I've become more interested in the integration of groups, in diversity in cities," he says. To paint the full picture, it's helpful to have a glimpse of his earlier research.
Can you tell me how to get to Sesame Street?
"Racial and ethnic inequality-in a society like ours, it's not supposed to exist,"
Farrell says. "The big question in my research is 'what are the reasons for racial
and ethnic inequality persisting within our society?' And on the rosier side, 'how
is it shifting and how is it becoming a more racially and ethnically inclusive society?'"
While there is marked racial and ethnic integration and diversity on PBS's Sesame Street (depending on how you categorize furry monsters and 8-foot tall talking birds), most communities in America, although trending more diverse, are not quite there yet. "It's one thing to say a city is diverse. That doesn't mean its neighborhoods are diverse. That's where segregation comes in," Farrell says. We still have a right side of the tracks-wrong side of the tracks dichotomy. Farrell is able to discuss this residential segregation in a way that sounds less polarizing and fleshes out some of its complexities.
"Opportunities are spatially allocated to an extent in terms of services, job opportunities, schools and social networks," Farrell says. "If groups are residing in different neighborhoods, that suggests there might be different access to opportunity structures. Also, problems are distributed unequally across neighborhoods-crime, environmental hazards, etc. So certain groups might be more exposed to hazards." The racial and ethnic groups that predominate in distinct neighborhoods of the same city are, therefore, not in for the same experiences. His new research notes that while diversity is increasing, residential segregation continues to be a familiar feature of the urban landscape.
Farrell and co-authors Barrett Lee and Gregory Sharp (Penn State) showcased the results of a nationwide analysis of 1980-2010 U.S. Census data in their paper, "A Universal Trend? Racial and Ethnic Diversity in American Communities Over Three Decades," which they recently presented to the Population Association of America. "There's only so deep you can go with census data, but we're trying to squeeze everything we can out of it, in terms of tracking trends," he says. To that end, they've developed indices to further analyze the data that's available, drilling deeper than the U.S. Census Bureau.
 Alaska's diversity and how research could vindicate a former governor
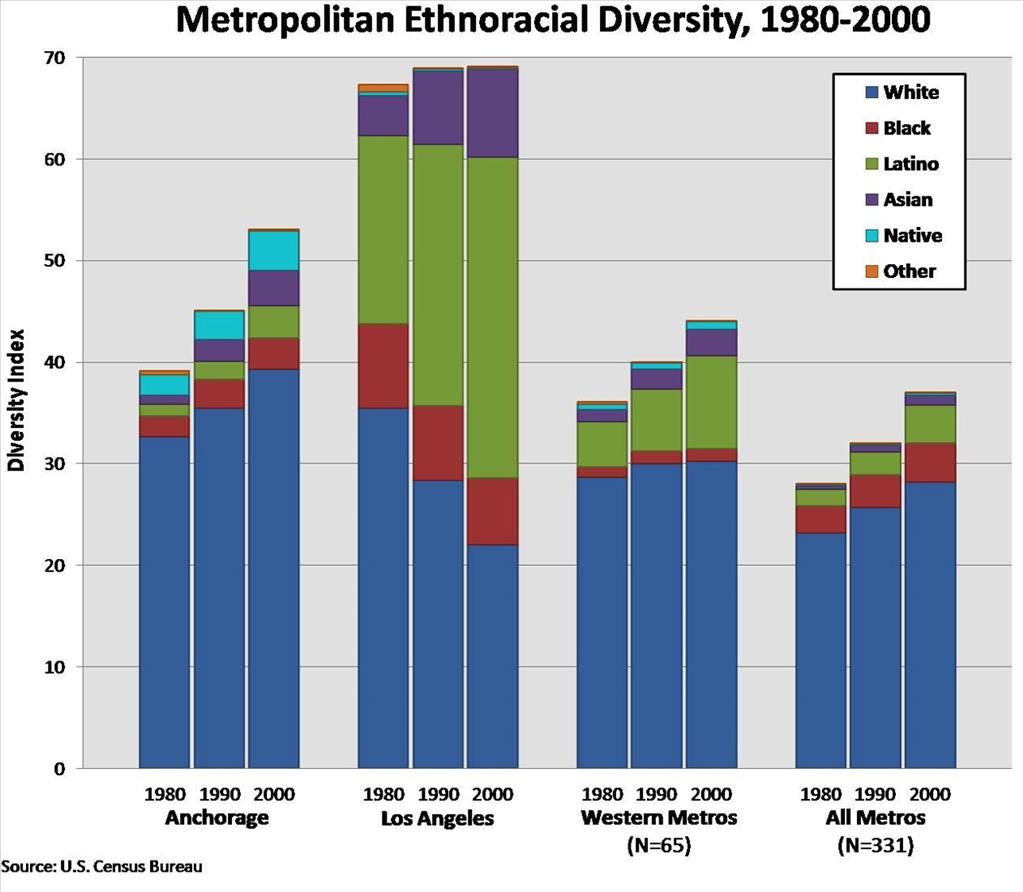
Widespread diversity is not just a Los Angeles-New York City phenomenon. Take Anchorage,
for example. Using Farrell's research methods, it ranks 10th among small metropolitan
areas for overall diversity and is the only metropolitan area with sizable (>5 percent)
black, Latino, Asian and Native populations.
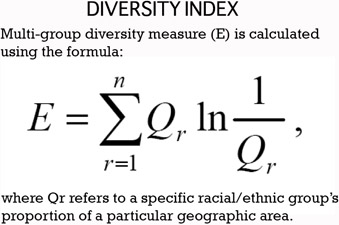
Farrell and his collaborators measure community data using a diversity index that takes into account the number of racial and ethnic groups as well as their relative size. The index uses a 0-100 rating. "Zero indicates no diversity, only one group present-it's rare," Farrell says. "And 100 is perfect diversity-a number of groups all of equal size-also rare."
"A number of our communities in Alaska have very high levels of racial and ethnic diversity. And not just urban Alaska; there are a number of rural areas that rank really high on this index." Among 574 smaller "micropolitan" areas, Kodiak is ranked fifth nationally and both Juneau and Ketchikan have diversity scores above the 90th percentile. The Aleutians West Census Area and Aleutians East Borough are the two most diverse rural areas in the entire United States, ranking highest among the 1,357 rural counties, boroughs and parishes studied by Farrell and his fellow researchers.
 There is one notable (and unintended) by-product of Farrell's research as it pertains
to Alaska-the vindication of former governor Sarah Palin. "She took some heat during
the previous presidential election-I think she referred to Alaska as a microcosm of
America-and she took some heat from pundits," Farrell says. "Well, our research indicates
that at least in terms of racial and ethnic diversity, many Alaska communities are
really at the forefront of this trend that we're seeing across the U.S."
There is one notable (and unintended) by-product of Farrell's research as it pertains
to Alaska-the vindication of former governor Sarah Palin. "She took some heat during
the previous presidential election-I think she referred to Alaska as a microcosm of
America-and she took some heat from pundits," Farrell says. "Well, our research indicates
that at least in terms of racial and ethnic diversity, many Alaska communities are
really at the forefront of this trend that we're seeing across the U.S."
The U.S. Census: a reader's guide
Getting cozy with U.S. Census data may not be everybody's cup of tea, but Farrell's
enthusiasm for data mining is evident when you see him in front of his Demography
class. The lecture/lab class explores population growth and trends in fertility, mortality,
immigration and domestic migration and Farrell promises students he'll make understanding
and contextualizing data as painless as possible.
Sociologists have engaged in segregation research for decades. Diversity research like Farrell's doesn't have the same long history and he's compelled by the complexities he finds. The most recent U.S. Census data is based on five basic race categories (White, Black or African American, American Indian or Alaska Native, Asian and Native Hawaiian or Other Pacific Islander) and two ethnicity classifications (Hispanic or Latino and Not Hispanic or Latino). Those broad categories are pretty roomy and Farrell sees the potential for extended diversity research into the groups within groups-perhaps groups by national origin (i.e. Latino ethnicity with origination in Guatemala).
"There is more to know" could be a motto for every researcher since the beginning of time, and Farrell is no exception. He is excited to further hone his current diversity research with his colleagues. And he's thinking beyond numbers and graphs about the impact of his research. What does it mean that we're part of an upward trend in diversity? The next questions, he says, are "What are the consequences of diversity?" and "How do we harness that vitality and dynamism while avoiding the pitfalls of our nation's past?"
Anyone can run the numbers and join the conversation. (Take a tour of some U.S. Census data here .) If you'd like a little help, keep an eye out for Prof. Farrell's upcoming Demography courses and let him show you how the study of population growth can give you a leg up in your next debate about world
 "Studying urban inequality in Alaska and the U.S." is licensed under a Creative Commons Attribution-NonCommercial 4.0 International License.