NAEYC Annual Measures
 The Associate of Applied Science (AAS) in Early Childhood Development, at the University
of Alaska Anchorage, is accredited by the Commission on the Accreditation of Early
Childhood Higher Education Programs of the National Association for the Education
of Young Children, www.naeyc.org. The accreditation term runs from Spring 2018 through Spring 2025.
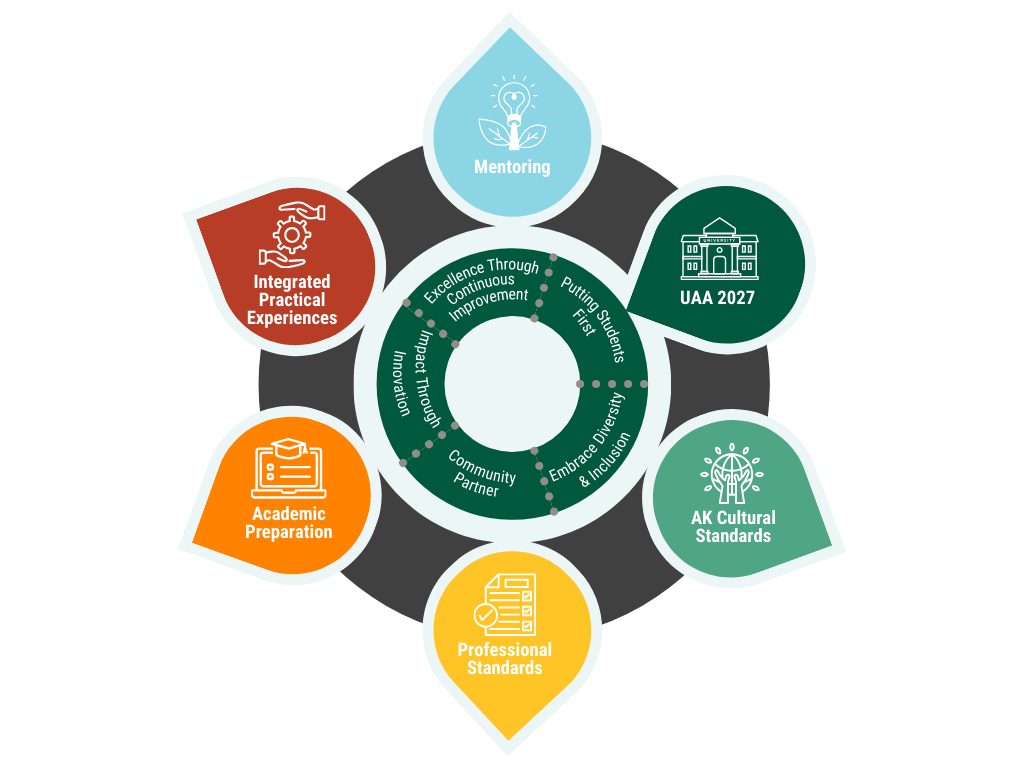
The University of Alaska Anchorage (UAA) Department of Early Learning & Teaching has adopted a conceptual framework rooted in UAA 2027, the institution’s Strategic Plan. UAA 2027 defines, communicates, and clarifies expectations for our mission, vision, values, and shared goals: Putting Students First, Enhancing Diversity & Inclusion, Community Partner, Impact through Innovation, and Excellence through Continuous Improvement. This foundational petal in the framework informs the other petals and all program operations. As noted by Aspiration #2, we prioritize embracing diversity and inclusion to ensure equity and access for all learners, including our candidates and the young learners they teach. The other five petals (Alaska Cultural Standards, Professional Standards, Academic Preparation, Integrated Practical Experiences, and Mentoring) form the other components necessary to “prepare educators and support the lifelong learning of professionals to embrace diversity and to be intellectually and ethically strong, resilient, and passionate in their work with Alaska's young children, families, and communities.”
Number of Program Completers
| Academic Year | Number of Program Completers | % of program completers who were attending full-time (at the time of completion) | % of program completers who were attending part-time1 (at the time of completion) |
| 2023-2024 | Data In Progress | Data In Progress | Data In Progress |
| 2022-2023 | 3 | 0% | 100% |
| 2021-2022 | 5 | 60% | 40% |
| 2020-2021 | 9 | 33% | 67% |
| 2019-2020 | 15 | 27% | 73% |
| 2018-2019 | 23 | 48% | 52% |
1 Part-time status is defined by the institution.
Program Completion Rates
| Academic year in which a fall cohort of full-time candidates enrolled in the program (select 3 sequential years) | % of those candidates who completed the program within 150% of the published timeframe | % of those candidates who completed the program within 100% of the published timeframe. |
| 2023-2024 | Data In Progress | Data In Progress |
| 2022-2023 | 100% | 67% |
| 2021-2022 | 60% | 60% |
| 2020-2021 | 67% | 33% |
| 2019-2020 | 100% | 25% |
| 2018-2019 | 100% | 46% |
Institutional Selected Data
The fall-to-fall retention rate in the program for each of the three most recently completed academic years
| Academic Year | % of Part-time Candidates Enrolled in the Program (% of Total Enrollment) | Retention Rate Among Part-time Candidates | % of Full-Time Candidates Enrolled in the Program (% of Total Enrollment) | Retention Rate Among Full-time Candidates |
| 2020-2021 | 72% | 28% | 22% | 78% |
| 2019-2020 | 73% | 27% | 27% | 73% |
| 2018-2019 | 74% | 26% | 26% | 63% |
1Part-time status is defined by the institution.
| Academic Year | Number of Graduates | Percentage of Graduates employed in the early childhood profession within one year of graduation* | Percentage of Graduates pursuing further education in the early childhood profession within one year of graduation* |
| 2023-2024 | N | Data In Progress | Data In Progress |
| 2022-2023 | 3 | 100% | 67% |
| 2021-2022 | 7 | 100% | 20% |
*The figures in these two columns do not need to add up to 100%


